Plotting Graph Tortuosity
One of the quantities of interest in the flow through porous media is not the properties of the matrix, but rather the properties of the corresponding pore space. In particular, there may be narrow passages called pore throats separated by wider, winding passages. Reduced pore throats and increased tortuosity often result in increased capillary pressure and a reduction in permeability.
For analysis purposes, you can plot the distribution of graph tortuosity and throat-weighted tortuosity between input and output boxes. Tortuosity is a measure of the departure of a pore space from an ideal system made of straight and parallel capillaries and can be defined as the ratio of actual path length to the straight distance between the ends of the path. Pore throats are defined as the smallest cross-sectional area of a pore channel, equal to the radius of a circle drawn perpendicular to fluid flow at the narrowest point.
Histograms of tortuosity and throat-weighted tortuosity

The tools at the top of the Histogram dialog let you to pan, zoom, and reset the histogram, as well as save the figure, adjust the figure, and export the histogram data to a comma-separated values file (*.csv extension).
| Item | Icon | Description |
|---|---|---|
| Pan |
|
Pans or zooms the figure as described below.
Pan… Click with the left mouse button and then drag to pan the figure. Zoom on the Y axis… Click with the right mouse button and then drag up and down to Zoom in and Zoom out on the Y axis. Zoom on the X axis… Click with the right mouse button and then drag left and right to Zoom in and Zoom out on the X axis. |
| Zoom |
|
Zooms to a drawn rectangle, which can be defined by dragging your cursor over the area that you want to zoom. |
| Reset |
|
Resets the original view of the figure. |
| Save |
|
Saves the figure as a bitmap image, vector graphic, or in the PDF file format. The figure can also be saved as raw data or PGF code.
Standard image files (*.jpeg, *.jpg, *.png, *.tif, *.tiff extensions)… Saves the histogram or profile as a bitmap image in the screen resolution. Postscript files (*.eps, *.ps extensions)… Saves the histogram or profile as an encapsulated postscript or postscript file. These types of files have a selectable resolution and provide high-quality graphics for publications. PGF code for LaTeX (.pgf extension)… Saves the histogram or profile in the Portable Graphics file format. The standard LaTeX picture environment can be used as a front end for PGF merely by using the Raw RGBA bitmap (*.raw, *.rgba extensions)… Saves the histogram or profile as a raw bitmap image file, in which the file contains only a list of pixel colors and nothing else. Scalable vector graphics (*.svg, *.svgz extensions)… Saves the histogram or profile in an XML-based vector image format. The SVG specification is an open standard developed by the World Wide Web Consortium (W3C). SVG images and their behaviors are defined in XML text files. Portable document format (*.pdf extension)… Saves the histogram or profile in the Adobe PDF file format. |
| Settings |
|
Opens the Figure options dialog, shown below, in which you can select the plotted ranges, scaling, and labels for the axes.
|
| Export to CSV |
|
Exports the plotted values in the comma-separated values (*.csv extension) file format. |

- Add box shapes to define the input and output of the segment of the graph that you want to plot (see Adding and Editing Shapes).
You can adjust the input and output boxes on the 3D view showing the graph or to the 2D views of the original region of interest, as shown below.

- Right-click the graph in the Data Properties and Settings panel and then choose Plot Graph Tortuosity in the pop-up menu.
- Choose the input and output boxes, as shown below.
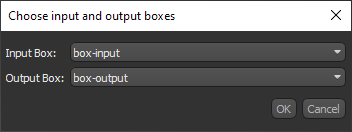
- Click OK to plot the tortuosity within the selected segment of the graph.

- Add box shapes that define the input and output of the segment of the graph that you want to plot (see Adding and Editing Shapes).
You can add the input and output boxes to the 3D view showing the graph or to the 2D views of the original region of interest, as shown below.
- Right-click the graph in the Data Properties and Settings panel and then choose Plot Graph Throat-Weighted Tortuosity in the pop-up menu.
- Choose the graph region of interest, as well as the input and output boxes, as shown below.
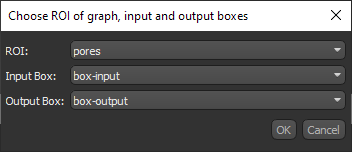
Note Throat-weighted tortuosity is sensitive to the spatial resolution of the region of interest under investigation.
- Click OK to plot the tortuosity within the selected segment of the graph.
